ENAC Accredited Photometric Tests
LED luminaires: UNE-EN 13032-4; CIE 34; CIE 52.
Luminaires with sources other than LEDs: UNE-EN 13032-1; CIE 34.
Tests carried out according to the
UNE-EN 13032-1 and UNE-EN 13032-4 standards
The 3D angular distribution of illuminance of the luminaire is determined in the photometric laboratory, minimizing the incidence in the detector of reflections and stray light.
By obtaining the light distribution of a luminaire, we have information about the amount of light emitted on each direction. Based on these data, we can perform different operations to calculate what is the total amount of light it emits (luminous flux), the amount of light emitted in certain directions (zonal flux), or how much light reaches different planes of interest (isoilluminance curves, cone diagram). With this initial information, a large number of parameters are calculated to analyze the product and its applicability in different project situations, compliance with requirements or identification of aspects to be improved in the product.
Our facilities allow us to measure luminaires up to
2 meters length.
Photometric test report:
The results provided in a photometric test report depend on the type of luminaire being analyzed (interior, vial or projector), as the application of the product is different.
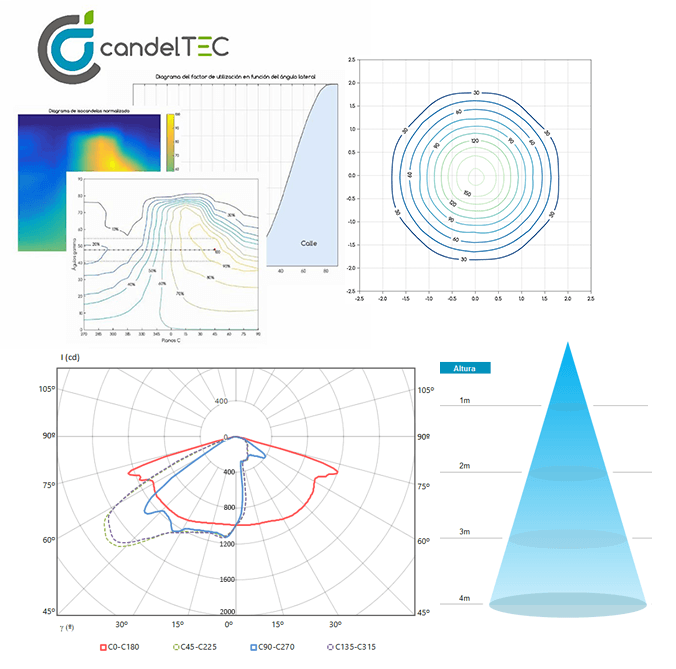
Some of the parameters and charts tipically included in the reports are:
- Luminous intensity distribution (tables including values at different C planes and gamma angles, with the uncertainty, polar and Cartesian graphical representations).
- Luminous flux, zonal fluxes, fractions of the flux emitted towards the upper and lower hemisphere, ICD codes.
- Efficiency, efficacy.
- Isoilluminance curves
- Beam opening, illuminance cone (minimum, average and maximum illuminance at different heights). .
- Throw, spread and control values for road luminaires. Isocandela diagram and roadway / walkway utilization factor curves.
- Power supply and electric parameters of the product (power, current, voltage, power factor).
IES and LDT files.
Preparation of LDT or IES files with each photometric characterization. Other photometric data exchange files can be also prepared.


